Shipping analytics Shipping analytics

Shipping Analytics: how to analyse delivery metrics and why you should

With shipment analysis, you can monitor delivery performance, analyse actual costs, identify inefficiencies and improve the customer experience.

Calculate Total Cost of Shipping

Total Cost of Shipping (TCS) Calculator
Scope: define a cohort (e.g. Q3, France, B2C)
1. Define the scope: e.g. “All domestic B2C orders in Q3” or “All shipments to France in the last 90 days”.
2. Enter the costs for the period and the total number of orders.
Total orders in the period (used to calculate the TCS per order)
Basic rates, fuel surcharge, extras, etc.
Pick/pack labour, packaging materials, labels, software, re-work.
Costs due to incorrect addresses, mis-measurements, reprints, etc.
Redelivery, RTS, reship, delays, exceptions management.
WISMO + other contacts × average cost per contact.
Refunds, discounts, vouchers, reshipments due to poor service.
Duties, taxes, brokerage, screening, document costs.
Compensation, SLA credits, discounts to be deducted from the total cost.
TCS Total (period)
€ 0.00
TCS per order
€ 0.00
(TCS Total ÷ Number of orders)
Tip: Update these figures monthly with a rolling 3-month view and segment the TCS by product, service, destination and channel to quickly identify areas for improvement.

Shipping Analytics: all resources

AI

What's Shipping Analytics

Discover the basics of analysing shipments and returns.


Read more →

AI

Benefits of shipment analysis

Why should you analyse your shipments? Find out here.


Read more →

AI

Shipping KPIs and key metrics

Transit time, return rate, delivery time... these are the shipping KPIs..


Read more →

AI

Business intelligence

How to implement a shipment analysis system? Let's start with the basics.


Read more →

AI

Resources

Statistics, case studies and trends in shipping analytics to stay up to date.


Read more →

AI

FAQs

Everything you wanted to know about shipment and return analysis.


Read more →

What's shipping analytics?

What's shipping analytics?

Shipping analytics is the process of collecting, organising and analysing shipping-related data (transit times, costs, returns, carrier performance, volumes, etc.) to gain insights that support operational and strategic improvement.


This approach makes it possible to turn raw, fragmented data into structured information that can be used to measure efficiency, anticipate issues, optimise costs and improve the customer experience.

Benefits of shipping analysis

What are the benefits of shipping analysis?

Cost control: shipping costs often represent a significant share of an ecommerce business’s total logistics costs.

Visibility and transparency: enables a unified view of all shipping data, including costs, delivery times and carrier performance.

Data-driven decision-making: allows operational and strategic decisions to be made based on real business data and statistics.

Process optimisation: analysing shipments helps identify inefficiencies, reduce lead times, minimise errors and returns, and improve overall service quality.

Improved customer experience: faster and more reliable deliveries increase customer satisfaction and trust, supporting long-term loyalty.

shipping KPIs

What to analyse: shipping KPIs and key metrics

To assess shipping performance and its financial impact, it is essential to monitor a set of KPIs and metrics, including:

  • Average delivery time / transit time: measures how long parcels take to reach their destination.
  • On-time delivery rate: the percentage of shipments delivered within the promised timeframe.
  • Average cost per shipment / per order: useful for understanding the impact of logistics costs on revenue.
  • Return rate: helps assess the reliability and quality of deliveries.
  • Carrier performance, such as error rates, failed deliveries and damaged shipments.
  • Hidden costs and surcharges, for example extra carrier fees, delays, returns to sender, returns handling, and related charges.
routing-optimizer@3x

How to implement a shipment analysis system

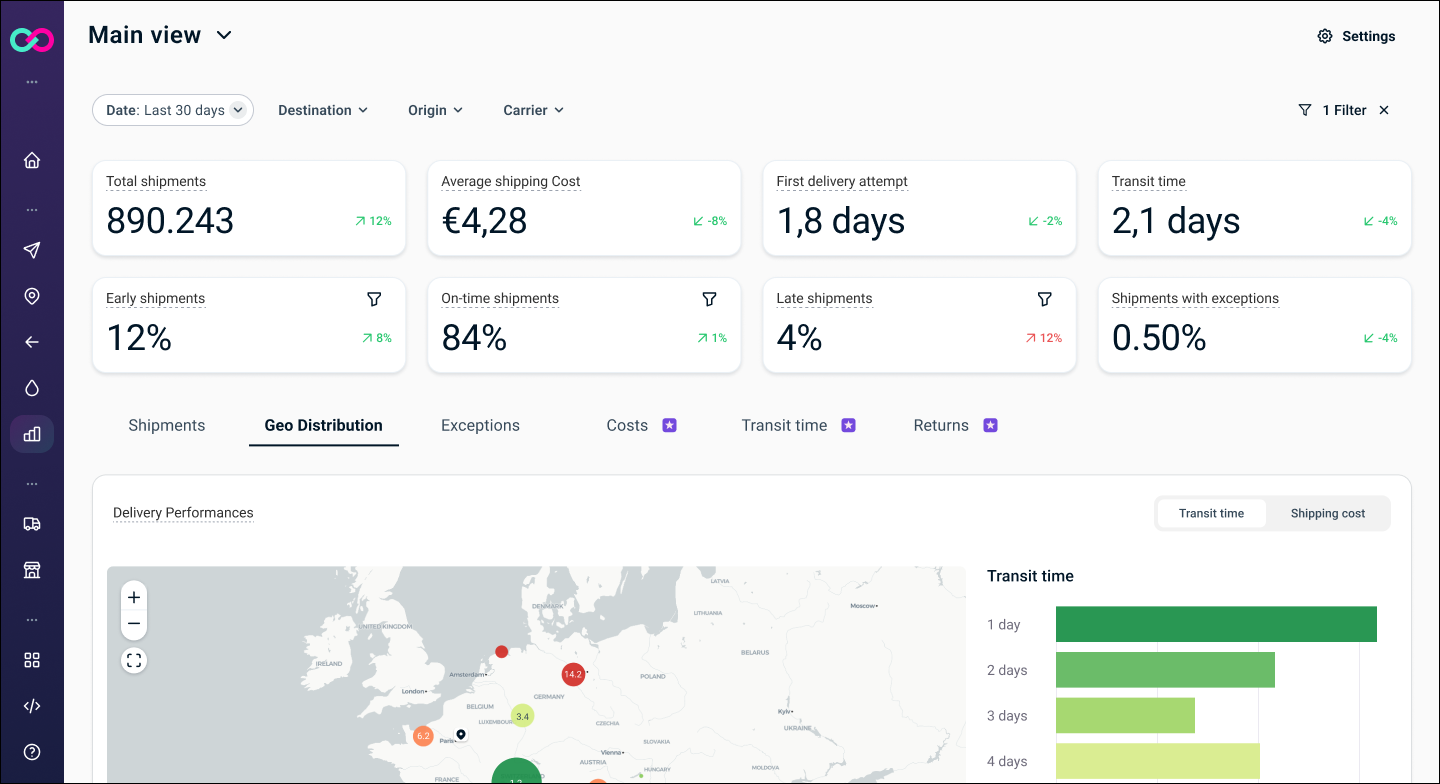
Implementing a shipping analytics system first and foremost means bringing order to data: delivery times, costs, carrier performance and returns.


Once this information has been collected and consolidated, it becomes much easier to understand how shipments are really performing.


Clear, up-to-date dashboards make it possible to quickly identify delays, inefficiencies or meaningful trends, turning what was once based on intuition into something measurable. This is where more informed decisions take shape, helping optimise costs, improve service quality and make deliveries more seamless.

Shipping Intelligence & ShippyPro: what's in for you?

Shipping Intelligence

Monitor shipping KPIs by courier and country, track exceptions and returns for more informed shipment management.

automation

Automation and Artificial Intelligence to speed up order fulfilment and label creation.

Shipping analysis: FAQs

Shipping Analytics is the set of processes that collect, organise and analyse shipping data to transform it into useful information for improving performance, costs and operational decisions.
Analysing shipping data helps identify inefficiencies, reduce costs, monitor punctuality and improve the customer experience, replacing intuition with data-driven decisions.
Metrics such as delivery times, shipping costs, courier performance and return rates are monitored to identify trends, inefficiencies and opportunities for optimisation.
By comparing couriers' performance and costs using historical data, you can understand which couriers meet SLAs, offer lower costs or provide more reliable performance.
Yes: by analysing returns data, you can identify recurring causes, reduce problems and optimise processes to improve satisfaction and costs.
You can start with basic tools, but dedicated platforms offer dashboards, visualisations and comparisons between couriers that make analysis more immediate and effective.
Yes: advanced solutions enable real-time monitoring of performance and trends, helping you to react quickly to delays or operational anomalies.
It depends on the available data: with well-organised data and appropriate tools, implementation can be gradual, starting with simple dashboards and progressing to more advanced analyses.
There are four levels: descriptive analysis shows what happened in shipments; diagnostic analysis explains why it happened; predictive analysis estimates what will happen based on trends; finally, prescriptive analysis suggests the best actions to reduce costs, improve performance and prevent operational problems.